
Maximize Sales with QR Menu Analytics Data Insights
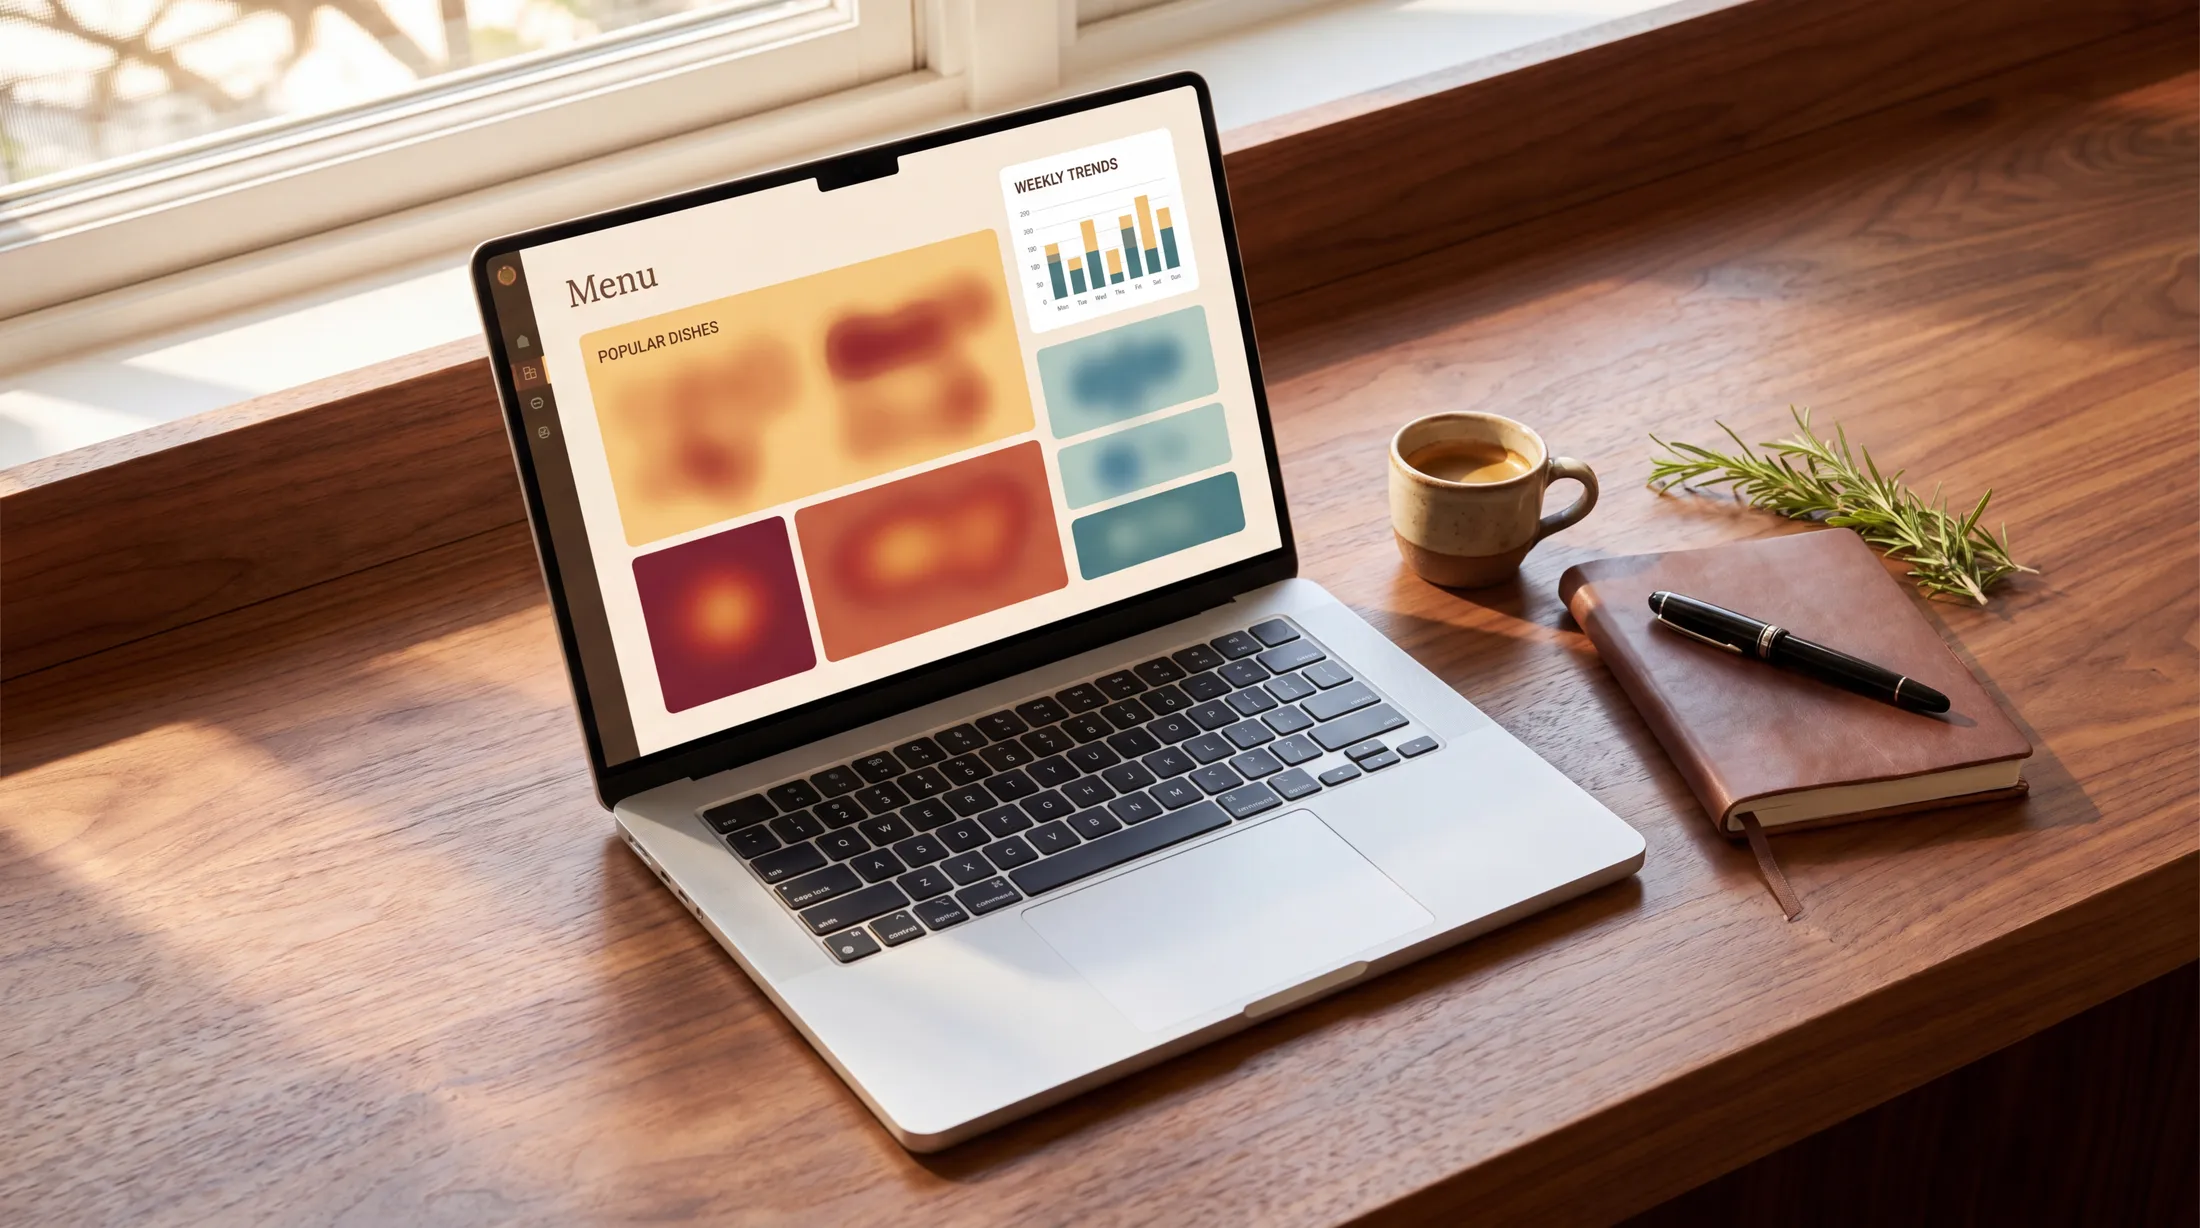
A QR menu in 2026 records a small set of anonymous signals (menu views, dish opens, the languages guests read in and where they came from) and pairs them with the sales in your POS.
TL;DR — Key Takeaways
A QR menu records a handful of things without any sign-in or app: menu views (with the language each was read in), dish opens, where guests came from (QR scan, direct link, another website or a tagged campaign link), and the busiest and typical day. Each one drives a different decision.
The single most actionable comparison is dish opens vs. POS sales, compared by hand: dishes that get opened often but sell rarely are description, photo or pricing problems with clear fixes.
The menu does not know what was ordered. Order counts, sales and margins come from your POS or till; the menu tells you what guests looked at.
All of this is GDPR-compliant by design when handled correctly — restaurant menu analytics work with anonymous engagement data, not personal identifiers.
Operators who review their menu data weekly, next to their POS sales, turn menu engineering into a habit instead of a quarterly guess.
What data can I get from a QR menu?
A QR menu in 2026 records a small set of anonymous signals. On Intermenu they are recorded on the public menu without sign-in or install, and the counts are kept clean: a guest reloading within 10 minutes counts once, and your own signed-in visits are excluded.
1. Menu views and timing. How many times guests opened the menu over 7, 30 or 90 days, with a daily chart, the busiest day and a typical day. Tells you about traffic patterns across the week.
2. Dish opens. How often each dish is opened, the five most-opened dishes, and the dishes nobody opened. The underused goldmine of menu engineering.
3. Where guests came from. QR scan, direct link, another website or a tagged campaign link. Tells you whether your printed codes, your Google profile or your social posts are bringing guests to the menu.
4. Language split. Which language each view was read in, and on Intermenu's Pro and Multi plans, views per language and each language's share. Tells you whether your multilingual investment matches your actual guest mix.
5. Sales from your POS. Not a menu metric, but the one to pair with every menu metric. The menu takes no orders, so order counts, revenue and margins come from your POS or till. Set them next to dish opens by hand, or download the menu data as a spreadsheet and join the two there.
These metrics are useless to you in raw form. They're powerful when interpreted, and they should be reviewed weekly — not quarterly.
Which menu items get viewed but not ordered? Why does that gap matter?
This is the most actionable question QR menu analytics can answer.
A "high view, low order" dish is one that guests open often on the menu but that rarely shows up in your POS sales, compared by hand. There are five common causes:
1. The description doesn't sell the dish. A dish titled "Grilled Branzino" with a description of "Mediterranean sea bass with seasonal vegetables" is technically accurate but doesn't communicate why a guest should order it. Rewrite to highlight what makes it distinct: "Whole branzino, salt-baked tableside, served with charred lemon and a Sicilian salmoriglio sauce."
2. The price feels off relative to the description. If a dish reads as "comfort food" but is priced at the high-end of the menu, guests view but don't buy. Either reframe the dish (premium ingredients, technique, region of origin) or reprice.
3. There's no photo. This is the easiest fix. Photos lift conversion 25–30% on average. AI-generated dish photography (available in platforms like Intermenu on every plan, from a monthly image allowance) closes this gap immediately.
4. The dish has a competing dish nearby on the menu. If a guest is choosing between two similar dishes, opens go up on both but sales concentrate on whichever wins the comparison. Differentiate the descriptions.
5. The dish has an allergen or dietary marker that excludes the guest population. If many of your guests avoid shellfish and your octopus dish gets opened a lot, the issue may be structural — those opens can be guests checking the allergen line to confirm what they can't eat.
The diagnostic workflow: each month, set your most-opened dishes beside your POS sales and pick the top 5 "high-view low-order" dishes, hypothesize the cause, change one thing per dish, run another month, see what moved. This is a simple before-and-after rhythm — and it's what menu engineering looks like in 2026.
Can I track peak ordering times by table?
Not from the menu alone, and it's worth being clear about why.
What the menu can tell you: how many guests opened it, on which days, and where they came from. Intermenu gives each menu one QR code, so it does not split views by table, and it does not measure how long a guest spends reading.
What only your POS knows: the actual orders, and when each table ordered. That data lives in your POS system, and it is the right source for per-table timing.
What this enables operationally:
Use POS order times to see which tables and sections are slow to order — often a sign of ambiguous menu content or a service bottleneck.
Use the menu's busiest day and typical day to plan staffing for the days guests read the menu most.
Spot patterns in service quality by section from the POS — if a server's tables consistently take longer to order, the bottleneck might be service, not menu.
For capacity planning, the POS is again the source: if order times on Friday nights run much longer than on Tuesdays, your Friday service planning needs to account for the longer menu phase.
How do I A/B test menu changes with QR analytics?
The three most useful menu tests, run as before-and-after comparisons:
Test 1: Dish description. Run the old description for two weeks, then the new one for two weeks, and compare the dish's opens and its POS sales across the two periods. Sample size needed: at least 200 views per version for statistical confidence.
Test 2: Dish position. Move a high-margin dish from third in its section to first. Most QR menus have section-position effects similar to printed menus — items at the top of a section get more attention.
Test 3: Photo vs no photo. The simplest and highest-impact test. Add a photo to a dish that didn't have one and watch its POS sales move. The lift is typically 25–30% in the photographed dish.
The mechanics: some platforms offer a split mode where half the guests see version A and half see version B. Sequential tests (version A for two weeks, then version B for two weeks) work on any live menu — slightly less rigorous but still informative.
Intermenu makes a description rewrite or a new photo live on the guest's next load, and its menu views screen compares 7, 30 or 90-day windows, so a sequential test needs nothing more than a note of the date you made the change and your POS report.
Is QR menu data GDPR compliant?
Yes — when handled correctly. The compliance frame is simpler than most operators expect.
What QR menu analytics typically collect:
Anonymous scan events (timestamp, language, device type)
Anonymous interaction events (which dish was opened)
What QR menu analytics should NOT collect without explicit consent:
Email, name, phone number
Precise GPS location
Cross-site tracking identifiers
What you need to do for GDPR compliance:
Privacy notice on the menu page. A short, clear paragraph explaining that anonymous engagement data is collected to improve the menu. Most platforms include this template.
Cookie/consent banner if you use any tracking that requires consent. Default analytics (anonymous, no PII) typically don't require a banner. Ad-platform tracking pixels do.
Data retention policy. Most platforms default to 12-24 months of retention; this is fine for GDPR purposes.
A way for guests to opt out. Usually a "do not track" link in the footer.
For most independent restaurants using a reputable hospitality platform, GDPR compliance is handled by default — the platform sets the right cookie behavior, the retention policy, and the privacy notice. For enterprise hotel groups, additional compliance documentation (DPIAs, processor agreements) may be required.
Don't let GDPR concerns scare you off menu analytics. Anonymous engagement data is exactly what GDPR was designed to permit. The compliance hard part is the personal-data-tracking the menu shouldn't be doing in the first place.
What's the right data to look at weekly vs quarterly?
Weekly review (5 minutes):
Total menu views vs the period before
Top 5 most-opened dishes (any change?)
Top 5 high-view-low-order dishes, from dish opens set beside POS sales (any to address?)
Any technical issues (slow load times, scan failures, error rates)
Monthly review (30 minutes):
Views per language (is your translation investment paying off?)
Where guests came from: QR scan, direct link, other websites, campaign links
The dishes nobody opened (and whether they sit near the bottom of their section)
Before-and-after test results from the prior month
Average check size from the POS, next to the month's language mix
Quarterly review (2 hours):
Full menu engineering review: dish opens from the menu beside sales and margins from the POS
QR scans vs. other sources (are your printed codes pulling weight?)
Growth in menu views against the same period last year
Strategic decisions: language additions, allergen visibility upgrades, photo coverage gaps
The weekly cadence is the one that compounds. Most operators do a quarterly review and miss most of the value. The 5-minute weekly check catches small problems before they become permanent menu features.
What's a "good" QR menu engagement rate?
There is no cross-restaurant benchmark worth copying, because engagement depends on your cuisine, your guest mix and whether paper menus sit alongside the QR. Compare yourself with yourself instead: Intermenu's menu views screen states the change against the previous period in a sentence (for example, "12% more than the 30 days before"), and that trend, read next to your POS sales, is the number that matters.
How to use analytics to drive a 10% AOV lift in 90 days
The standard analytics-driven AOV lift workflow:
Days 1-7: Open your menu insights and your POS report. Note your starting numbers. Check that visits from your printed QR codes show up as QR scans.
Days 8-30: Set your most-opened dishes beside your POS sales and pick your top 10 "high view, low order" dishes. Hypothesize causes. Make one change per dish (rewrite description, add photo, adjust price, reposition).
Days 31-60: Measure impact. Some changes will work, some won't. Roll back failures. Identify your top 5 successful changes; replicate the pattern across other dishes.
Days 61-90: Apply pattern to the next layer of dishes. Run a before-and-after test on the highest-margin dish to optimize its description.
By day 90, the lift in average check size shows up in your POS, driven by menu engineering decisions backed by data. The work is 30 minutes per week, not 30 hours.
Frequently Asked Questions
What data can I get from a QR menu? Menu views (with the language each was read in), dish opens, where guests came from, and the busiest and typical day. Orders and sales come from your POS. All anonymous, GDPR-friendly.
Which menu items get viewed but not ordered? This is the highest-value diagnostic. High-view, low-order dishes (opened often on the menu, sold rarely according to your POS) are usually description, photo, or pricing problems with clear fixes.
Can I track peak ordering times by table? Not from the menu: a QR menu doesn't know what a table ordered or when. Order timing per table comes from your POS.
How do I A/B test menu changes? Run sequential tests: version A for two weeks, then version B, comparing dish opens and POS sales across the two periods. 200+ views per version is the rough threshold for statistical confidence.
Is QR menu data GDPR compliant? Yes, when collected anonymously. Standard QR menu analytics use no personal data and require no consent banner. Reputable platforms handle compliance by default.
See Your Menu's Hidden Bestsellers
If you've been running a QR menu for a year and never opened the analytics, there are dishes in your menu costing you money quietly — viewed often, ordered rarely, fixable in 10 minutes.
Intermenu opens this layer of insight from day one — menu views, dish opens, the dishes nobody opened and where guests came from, plus views per language on Pro and Multi — alongside the multilingual menu and AI dish photography that often drive the fixes.
Open your menu's analytics and find your 3 quick-win dishes →