
How to Use Menu Analytics to Sell More
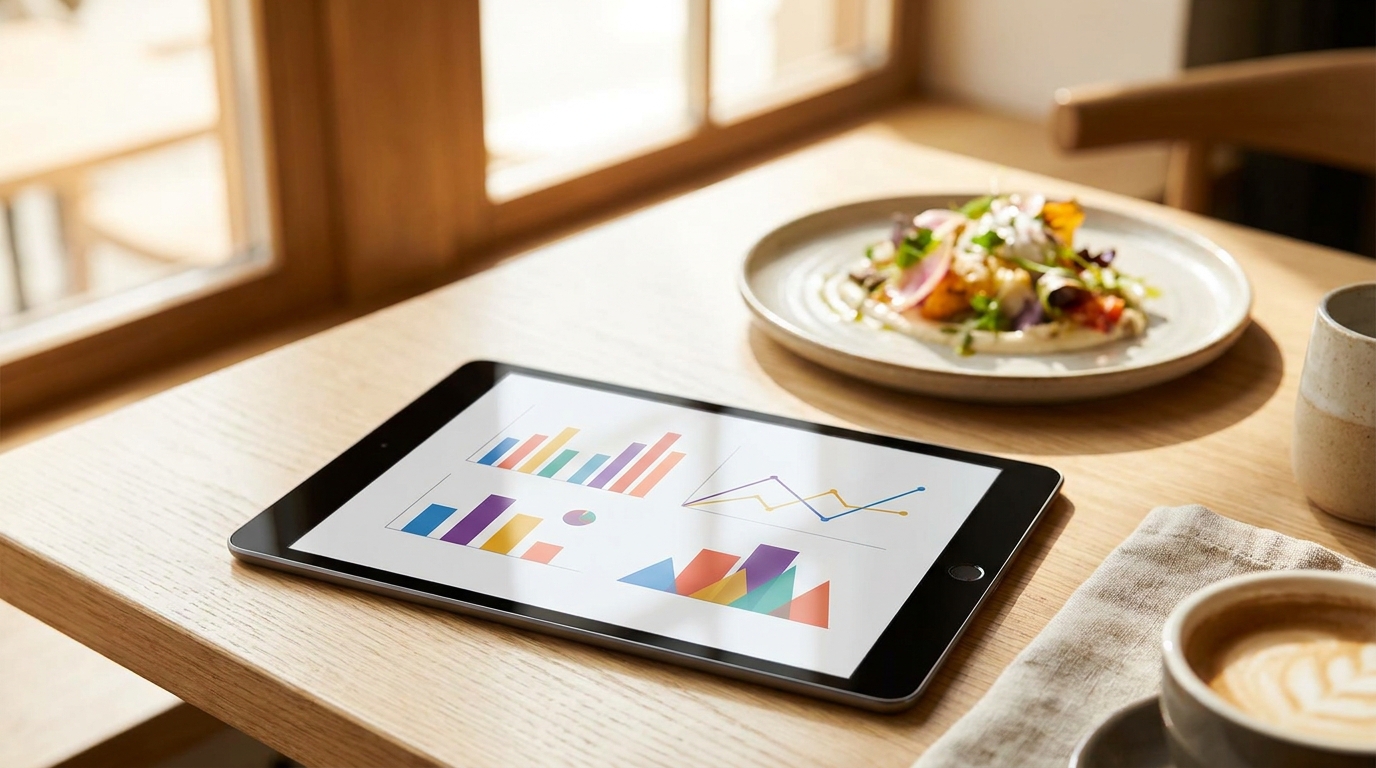
A printed menu never reports back. A live one counts how many guests opened it, which dishes they tapped, and which ones nobody touched all month. What it cannot tell you is what anybody ordered — and knowing exactly where that line falls is what makes the numbers useful instead of misleading.
TL;DR — Key Takeaways
A digital menu measures attention, not sales. It records what guests looked at; your POS records what they bought. Pairing the two is your job, not the software's.
Three things get counted: menu views (and the language read in), dish opens, and where the guest arrived from — a QR scan, a direct link, another website, or a campaign link you tagged.
The counts are cleaned first. A guest reloading within ten minutes counts once, and your own signed-in visits are excluded.
The most valuable list is the dishes nobody opened— read with the position caveat in hand, since items near the bottom of a section get opened less whatever they are.
This is a slow instrument. One week of data is noise. Change one thing, wait, look again.
Pairing is where the insight is. Menu views beside POS sales sorts dishes into four quadrants; the ones opened often but rarely bought are your best fixes.
New to the whole project? Start with how to digitize your restaurant menu— this article is what happens after it is live.
The difference between a document and an instrument
A printed menu is a broadcast. You design it, print it, hand it out, and from that moment you learn nothing. If the lamb shank sold four portions last month, there are three explanations — nobody wanted it, nobody saw it, nobody understood it — and no way to tell them apart.
A live menu closes part of that gap. It cannot tell you why the lamb shank failed, but it tells you whether guests ever opened it. A dish opened forty times and sold twice has a description, price or photo problem. A dish opened twice has a placement problem, and rewriting the description will do nothing.
That is the whole value of menu analytics, and it is narrower than most software marketing suggests. Attention sits upstream of sales. Mistaking one for the other is how owners cut dishes for the wrong reason.
Exactly what is measured
It is a short list, and knowing its edges matters. On a live Intermenu menu, recorded without any sign-in or install on the guest's side:
Menu views— how many times the menu was opened, including the language it was read in.
Dish opens— how many times a guest tapped a dish row to open its full detail sheet, with the large photo, story, calories and allergens.
Where guests came from— a QR scan, a direct link, another website, or a campaign link you tagged yourself.
That last one is more practical than it sounds. Scans and direct links show up separately, so your table tents and your Instagram bio are not pooled into one number. After a print run of QR code menus for your tables, you can see whether guests scan them or arrive from your website instead — and a tagged campaign link puts a flyer or a paid post on its own line.
Where guests came from, and what to do with each
Mostly QR scans? Your online presence isn't sending anyone. The link belongs in your Instagram bio, on your Google profile, and behind your site's "Menu" button; getting your menu found online is its own job.
A large direct-link number? People read you before they walk in — your photos and descriptions are doing sales work.
Arrivals from another website? Something out there is working; find it and feed it.
A tagged campaign link showing nothing? You know that before you print the next run, and two thousand flyers cost real money.
How the counts are kept honest
Two rules do most of the work here, and both matter if you intend to act on the number.
A guest reloading within ten minutes counts once. Otherwise the guest who opens the menu, puts the phone down, picks it up with the drinks and opens it again before dessert counts as three — and one table of six looks like a busy Saturday. The window collapses that into one view, so "86 guests opened your menu" means roughly eighty-six decisions, not eighty-six taps.
Your own signed-in visits are excluded. Owners are by a wide margin the heaviest users of their own menu: you check it after every price change, you open the sea bass to confirm the photo saved. If those counted, the dishes you edit most would look like the dishes guests love most — exactly backwards.
Neither rule is glamorous. Both are why the numbers are worth reading.
The menu views screen, in plain sentences
Pick a window of7, 30 or 90 days, and the screen answers in sentences rather than making you interpret a dashboard.
A headline— something like "86 guests opened your menu."
A comparison with the period before— "That is 12% more than the 30 days before." That comparison is what carries the meaning; 86 tells you nothing until you know whether last month was 40 or 140.
A daily chart, so you see the shape of the period instead of one flattened total.
Four facts— times opened, busiest day, typical day, and dish views.
Typical day is the one I read first. One full Saturday can hide four dead Tuesdays; the typical day is the floor you are actually running on.
The 7-day window checks something you just changed. The 30-day window is for deciding anything. The 90-day window is for season and trend.
Everything on the screen downloads as a spreadsheet— for your own monthly report, or for lining the figures up against data the menu has never seen.
The five most opened — and the ones nobody opened
The screen also shows the five most-opened dishes and, more usefully, the dishes nobody opened.
The top five usually confirm what you suspect: your signatures, whatever sits at the top of the first section. Rarely actionable.
The never-opened list is the one to act on. It is the list paper could never give you: dishes that cost you prep discipline and kitchen space and go entirely unnoticed. Not unpopular. Unseen. A different problem, and a cheaper one to fix.
Before you conclude anything about a dish on it, take the caveat the product itself gives you seriously: dishes near the bottom of a section get opened less — which is a problem of how you organize the menu before it is a problem with the dish. Position is a confound. A dish sitting eleventh of twelve in Mains competes with the scroll, not with the other dishes. Until you have moved it somewhere visible and waited a couple of weeks, you have learned nothing about the dish — only about where you put it.
Rankings also only start once there is enough data behind them. A menu that went live on Thursday shows no top five — deliberately, because a ranking built on nine views is an invitation to act on noise.
The four confounds — read before you conclude anything
Every number on that screen has four explanations that have nothing to do with the dish.
Position. Dishes near the bottom of a section get opened less — the product says so itself, and it is the strongest effect on the page. Section order and dish order shape attention before the dish does. The golden triangle applies: eyes land top-center, top-right, top-left, which on a phone means the top of each section. A buried dish isn't being rejected; it isn't being seen.
The photo. A dish with a photo draws the eye; its unphotographed neighbor loses by default, not on merit. Photos lift orders on the photographed dish meaningfully — on the order of 25–30%, most of all on unfamiliar items. The two were never competing on equal terms.
Novelty. A new dish gets opened because it is new. Give it a few weeks before you read anything into the spike.
Volume. A week is noise. One quiet Tuesday can invert a ranking built on a small sample — which is why no top five appears until there is enough data.
All four are why you change one thing at a time.
A worked example: one month at a 38-dish bistro
These numbers are invented for illustration— not a real restaurant, not a benchmark. Picture a bistro: 38 dishes, five sections.
The 30-day window:412 guests opened the menu, 7% more than the 30 days before. Busiest day 31, typical day 13, dish views 690. The 13 is the honest number, not the one good Saturday.
The never-opened list holds six dishes. One is the duck leg confit, a dish the kitchen is proud of: zero opens in thirty days.
The tempting conclusion: nobody wants the duck, so cut the duck.
Why that is wrong. The duck sits ninth of nine in Mains, and it has no photo while five of the eight above it do. Its zero carries three explanations at once — the dish, its position, its presentation — which the data cannot separate.
The action: move it from ninth to third — one change, written down with the date.
Thirty days later:19 opens. Mains went from 210 opens to 224, so most of those 19 came out of its neighbors' share rather than out of thin air; total menu views were flat.
That proves the zero was about position, not the dish — it does not prove anybody ordered it. The POS showed duck sales going from 4 to 11, consistent with the move and not proof of it. The next experiment waits its turn: the duck still has no photo.
Three experiments, and what each result would mean
Run one at a time, and decide in advance what counts as a result — deciding afterward is how you talk yourself into any number.
1. Move one buried dish to the top of its section. Change nothing else and wait 30 days, not two weeks. A result: its opens rise clearly while the section's total stays roughly flat. Noise: a rise alongside a similar rise in total menu views — if the whole menu got busier, your dish won nothing.
2. Add a photo to your highest-margin dish that hasn't got one. Filter the Dishes page to dishes with no photo, pick the best margin, and let the dish editor build one from what the menu knows. Compare the 30 days after against the 30 before. A result: its opens rise while comparable dishes in the section hold steady. Noise: a rise in a section you also reordered. You are watching attention here — the 25–30% photo lift is an orders figure, and the menu cannot see orders.
3. Shorten an over-long section. Take a section of twelve or fourteen toward the 5–7 items per category commonly cited as the sweet spot for decision fatigue — split it, or retire the weakest items (restorable for 30 days). A result: the section's total opens hold or rise, redistributed across fewer rows. Noise: total opens falling by roughly what the removed dishes used to have — arithmetic, not an outcome. Judge the survivors.
Which languages your guests actually read in
On Pro and Multi, the report breaks views down by language: how many views each language got, and its share of the total.
This number decides where your own attention goes. AI translation gets a menu most of the way; the hand-editing grid — free, no run, no allowance — covers the last stretch. But you cannot hand-check five languages with equal care, and you should not try.
If German is 40% of your views and Italian is 2%, the German dish names are worth an hour of your evening and the Italian ones are worth whatever the AI produced. A year later those shares may have swapped — this is how you find out instead of assuming.
The last 24 hours, on the Today dashboard
For the daily glance, the Today dashboard carries menu views over the last 24 hours, compared with the same 24 hours a week earlier.
The week-earlier comparison is what makes it readable. Tuesday against Monday tells you about the day of the week, not about your menu. Tuesday against last Tuesday is a real comparison — and a hard drop is worth a check that nothing is broken: a section hidden by accident, table tents cleared off during a deep clean.
Today is for noticing. The menu views screen is for deciding.
How far back you can look, by plan
Free— the last 30 days. Enough for the weekly routine below, not for season-over-season comparison.
Básico— full history, back to the day your menu went live.
Pro— full history, plus the per-language breakdown.
Multi— everything in Pro, plus organization-level analytics comparing your locations. Each location keeps its own menu views; the organization view puts them side by side.
Current prices and the full comparison sit on the pricing page. What the plan changes is how much history and how much breakdown you get — not whether views are counted.
A ten-minute weekly routine
Pick a quiet morning, keep it in the same slot each week, and keep it short enough that you are still doing it in March.
1. Open the 30-day window. Read the headline and the comparison with the period before. That is your temperature, nothing more.
2. Check the typical day, not the busiest one.
3. Open the never-opened list. Pick one dish from it. One.
4. Ask where that dish sits. If it is near the bottom of its section, you have your answer, and it is not about the dish.
5. Move it up, into the top third of its section, where guests look first.
6. Write down what you changed and the date. A note on your phone is fine — in two weeks you will not remember whether it was the placement or the photo.
7. Next week, look again at that one dish.
Change one thing at a time. Two changes in the same week and you can never attribute the result to either of them.
If the dish is still unopened after you have moved it somewhere visible, the next experiment is obvious: a dish nobody opens with no photo is not a dish problem yet. Give it a photo and wait another two weeks —AI food photo prompts and the dish editor's generator will produce one from what the menu already knows about the dish.
And be patient. Restaurant volumes are small: a single week of data is noise — weather, a football match, a school holiday. The signal lives at thirty days and above.
What this can't tell you
Being clear about the limits is what makes the rest of it trustworthy.
It cannot tell you what sold. There is no ordering, no basket, no checkout. Guests read, decide, and order with your staff.
It cannot connect a dish open to a sale. The guest who opened the ribeye may well have ordered the chicken.
It has nothing to say about your check average, covers or tips — anything after the phone goes back in the pocket.
It cannot tell you why. A number tells you where to look, not what to fix.
The other half lives in your POS: sales, covers, margins. Pairing the two is the analysis nobody can do for you. Exported menu views beside POS sales for the same period is a ten-minute spreadsheet job once a month, and it answers what neither system answers alone —which dishes get plenty of attention and few sales. Those are your highest-value fixes: guests are already looking, so something on the dish itself is losing them.
Pairing it with your POS, step by step
Attention data says where guests looked; sales data says what left the kitchen. Nobody joins them for you — it is manual, ten minutes a month.
Export the menu views for a 30-day window and your POS item sales for exactly the same dates; mismatched windows produce nonsense with a confident face. Put them in one sheet, one row per dish — name, opens, units sold — and read it as four quadrants.
Opened a lot, sold a lot. Your stars. The job is protection, not optimization: keep them where they are and think hard before touching price or recipe.
Opened a lot, sold little. The quadrant only this pairing finds. Guests went looking and walked away: the description, the price or the photo is overpromising, or the dish is losing the final comparison to the one beside it. The attention is already there.
Opened little, sold well. Regulars order it without reading it — safe, loved, invisible to anyone new. If you want more of it, the fix is placement and a photo, not the dish.
Opened little, sold little. A genuine cut candidate — once you have ruled out position. Run the placement test first.
One warning: a dish open and a sale are not the same guest; you are comparing totals, not tracing people.
Questions this data cannot answer
Even after the join, some things stay out of reach.
Why someone left without ordering. The wait, the noise, the sold-out special — none reaches the menu.
Whether the guest who opened the ribeye ordered it. Nothing connects the two.
Whether that guest was a regular. No accounts, no sign-in — everyone is anonymous.
What the server recommended. Often the biggest influence of all.
What the check average was. Spend lives in the POS, not the menu.
Your POS holds the money answers; the rest comes from asking your servers, who already know which dishes guests hesitate over.
Read your menu's numbers free with Intermenu
Intermenu counts what guests open, which dishes they tap, which languages they read in and where they arrived from — reloads collapsed, your own visits excluded, so the figures mean what they say. The last 30 days come with the free plan, along with one location, 40 dishes and two languages.
Build your digital menu free with Intermenu →
Frequently Asked Questions
Does the menu tell me what guests ordered?
No. The menu is for reading and deciding — no ordering, no basket, no checkout — so nothing about the order ever reaches it. Guests order with your staff as usual, and your POS is the only record of what sold.
What counts as one menu view?
One guest opening your menu — reloads inside a ten-minute window count once, and your own signed-in visits are excluded. Closer to "one decision" than "one tap".
Can I see which dishes nobody looked at?
Yes, and it is the most useful list on the screen. Read it with the product's own reminder in hand: dishes near the bottom of a section get opened less, so check placement before you judge the dish.
How long before the numbers mean anything?
Rankings start once there is enough data, and in practice you want thirty days before deciding anything. A single week moves with the weather and the school calendar.
Can I see which languages guests read the menu in?
Yes, on Pro and Multi — views per language and each language's share. That is how you decide where your hand-editing time is best spent.
Can I get the numbers out of the app?
Yes. The report downloads as a spreadsheet, for your own monthly reporting or for lining menu views up against POS sales.
How do I tell whether a dish is unpopular or just badly placed?
Move it and wait: top third of its section, nothing else changed, thirty days. If the opens come, it was placement.
How do I combine menu views with my sales data?
By hand, once a month. Export menu views for a 30-day window and POS item sales for the same dates, then put them side by side, one row per dish. Sort by opens and sales into four groups; the dishes opened a lot and sold little are usually where the money is.